Hello
Im trying to figure out have I found a bug or am I just misunderstanding something
I have a pico W with an attached picodisplay 2.0, flashed with picow-v1.24.0-beta2-pimoroni-micropython.uf2
I am trying to draw arcs on a circle with the following code
from picographics import PicoGraphics, DISPLAY_PICO_DISPLAY_2, PEN_RGB332
from picovector import PicoVector, Polygon, Transform, ANTIALIAS_X16


display = PicoGraphics(DISPLAY_PICO_DISPLAY_2, pen_type=PEN_RGB332)

vector = PicoVector(display)
BLACK = display.create_pen(0, 0, 0)
WHITE = display.create_pen(255, 255, 255)
BLUE = display.create_pen(0, 0, 200)


WIDTH, HEIGHT = display.get_bounds()
MIDDLE = (int(WIDTH / 2), int(HEIGHT / 2))


face = Polygon()
face.circle(int(WIDTH / 2), int(HEIGHT / 2), int(HEIGHT / 2))

wedge = Polygon()
wedge.arc(int(WIDTH / 2), int(HEIGHT / 2), int(HEIGHT / 2), 0, 60)

display.set_pen(BLACK)
display.clear()
display.set_pen(WHITE)
vector.draw(face)
display.set_pen(BLUE)
vector.draw(wedge)
display.update()
The result is the attached image arc_60.png
To me the output seems to be a mirror of what I expect
0 Degrees is at the 6 o clock position instead of 12/0
and angle increases in the counter clockwise direction instead of clockwise
Is this a bug or am I misunderstanding / configuring the api
Here is what I get if I increase the “to” angle to 120
…this is just a rotation by -90 degrees, because in maths 0 degrees is actually not at 12, but 3 am position.
So, this is a logical thing as per the programmer’s definition - I would say.
…the rotation also works as defined in math…
I for one, am working with an offset of -45 degrees for my gauge with regard to the library’s zero position. The gauge then runs from -45 to 45, values are distributed automatically across this span - looks good, works fine. I am happy.
Next thing is to incorporate adaptive coloring, as I have a fixed GAR coding (green-amber-red) and this is inappropriate for some scenarios. It could also be RAG or RAGAR.
For air quality lower values are more dangerous and thus, the red area should be with the lower values rather than with higher ones (RAG).
Different again with humidity, there is a healthy range between 40-60 % (max. 70 %), which should be green, everything at those boundaries should be amber and even more far away should be colored red (RAGAR).
Need to think about on how to realize this best…
Currently, I call the function and pass on all parameters to let the gauge draw automatically, also the threshold for the levels (but fixed color-coded).
1 Like
…now I think, it’s better with regard to the particular scenario.
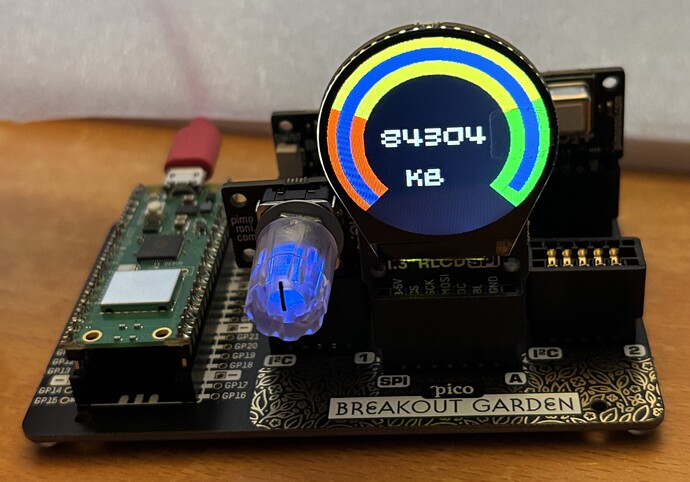
The breakout garden is quipped with all the glorious Pimoroni stuff, such as the multi sensors BME680 and CO2 sensor SCD41 as well as the round LCD. The rotary encoder is used to switch the various sensor modes and between the visual effects. Powered by the old fashioned RP2040, it’s plenty of power to do some low-level measurements and display stuff…
For RAM consumption, the red area is supposed to be the lower one - thus, RAG coding fits best.
For temperature, I go for GAR colors.
Humidity indicates the optimal range in the middle - AGA coded.
Pressure is somehow AGA coded, as well…not sure currently if I like it that way…
Air quality is GAR coded again.


