75 W. I’ve been trying to do best practice and edit my code locally on the Host PC. That works fine. It all goes down hill when I try to save as main.py to the i75 W.
If freezes with the following on screen in Thonny.
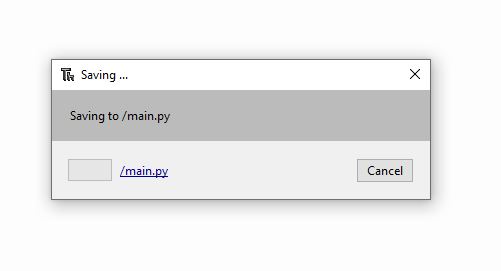
Then if I cancel or X out the i75 W is MIA to Thonny. It’s seems to be hit or miss, with more miss. I actually got it to save and run. But when I went in and made a minor edit it locked up again during the save. Then went MIA again.
Sometimes just clicking stop will get it back, but when i run my file from Thonny I get the no module names interstate75 message. Only way to get it back is to reflash the uf2 file.
I’ve had to do that twice already this morning.
It’s been running just fine now for a couple of hours with the following code, running from Thonny.
import time
import machine
from interstate75 import Interstate75
from interstate75 import Interstate75, SWITCH_A, SWITCH_B
i75 = Interstate75(display=Interstate75.DISPLAY_INTERSTATE75_128X32, stb_invert=True)
graphics = i75.display

from breakout_bme280 import BreakoutBME280
from pimoroni_i2c import PimoroniI2C

i2c = PimoroniI2C(sda=(20), scl=(21))
bme = BreakoutBME280(i2c, 0x77)
temperature, pressure, humidity = bme.read()

rtc = machine.RTC()
print(f"Getting time from Pico RTC/Thonny: {rtc.datetime()}")
year, month, day, weekday, hour, minute, second, microsecond = rtc.datetime()

graphics.set_font("bitmap8")
#graphics.set_font("8x12")
#graphics.set_font("10x14")

t_color = graphics.create_pen(0,0,0)
h_color = graphics.create_pen(0,0,0)
p_color = graphics.create_pen(0,0,0)

black = graphics.create_pen(0,0,0)
red = graphics.create_pen(255,0,0)
green = graphics.create_pen(0,255,0)
blue = graphics.create_pen(0,0,255)
yellow = graphics.create_pen(255,255,0)
orange = graphics.create_pen(255,140,0)
white = graphics.create_pen(224,224,224)

graphics.set_pen(black)
graphics.clear()
i75.update(graphics)
i75.set_led(0, 0 ,0)

# converts the temperature into a description and pen colour
def describe_temperature(temperature):
    global t_color
    if temperature < -10:
        description = "Very Cold"
        t_color = white
    elif -10 <= temperature <= 0:
        description = "Cold"
        t_color = blue
    elif 0 < temperature <= 12:
        description = "Cool"
        t_color = yellow
    elif 12 < temperature <= 16:
        description = "Warm"
        tempcolor = green
    elif 16 < temperature <= 24:
        description = "OK"
        t_color = green
    elif 24 < temperature <= 27:
        description = "Hot"
        t_color = orange
    elif temperature > 27:
        description = "Very Hot"
        t_color = red
    return description

# converts humidity into a description and pen color
def describe_humidity(humidity):
    global h_color
    if humidity < 30:
        description = "Low"
        h_color = red
    elif 30 <= humidity <= 60:
        description = "OK"
        h_color = green
    elif 60 < humidity < 80:
        description = "High"
        h_color = yellow
    elif humidity >= 80:
        description = "Very High"
        h_color = orange
    return description

# converts pressure into barometer-type description and pen color
def describe_pressure(pressure):
    global p_color
    if pressure < 982:
        description = "Very Low"
        p_color = red
    elif 982 <= pressure < 1004:
        description = "Low"
        p_color = yellow
    elif 1004 <= pressure < 1026:
        description = "OK"
        p_color = green
    elif 1026 <= pressure < 1048:
        description = "High"
        p_color = blue
    elif pressure >= 1048:
        description = "Very High"
        p_color = orange
    return description

temperature, pressure, humidity = bme.read()
time.sleep (0.5)

while True:
    graphics.set_pen(black)
    graphics.clear()
    i75.update(graphics)

    year, month, day, wd, hour, minute, second, _ = rtc.datetime()

    graphics.set_pen(white)
    graphics.text(f"{day:02}:{month:02}:{year:02}", 0, 9, scale=1)
    #display.text("year, month, day,rtc_date", 170, 0, scale=1)
    if hour <10:
        graphics.text(f"{hour:1}:{minute:02} AM", 0, 0, scale=1)
    elif 10 <= hour < 12:
        graphics.text(f"{hour:2}:{minute:02} AM", 0, 0, scale=1)
    elif hour == 12:
        graphics.text(f"{hour:2}:{minute:02} PM", 0, 0, scale=1)
    elif hour >12:
        hour = hour - 12
        if hour <10:
            graphics.text(f"{hour:1}:{minute:02} PM", 0, 0, scale=1)
        elif 10 <= hour < 12:
            graphics.text(f"{hour:2}:{minute:02} PM", 0, 0, scale=1)
        elif hour == 12:
            graphics.text(f"{hour:2}:{minute:02} AM", 0, 0, scale=1)

    temperature, pressure, humidity = bme.read()

    temperature = round(temperature)
    humidity = round(humidity)
    pressure = round(pressure)
    pressuremb = pressure / 100

    describe_temperature(temperature)
    graphics.set_pen(t_color)
    graphics.text("{:0.0f}°C" .format(temperature), 0, 18, scale=2)
    #graphics.text(describe_temperature(temperature), 30, 15,scale=1)

    describe_humidity(humidity)
    graphics.set_pen(h_color)
    graphics.text("{:0.0f} %".format(humidity), 64, 2, scale=2)
    #graphics.text(describe_humidity(humidity), 30, 25, scale=1)

    describe_pressure(pressure)
    graphics.set_pen(p_color)
    graphics.text("{:0.0f}mb" .format(pressuremb), 64, 18, scale=2)
    #graphics.text(describe_pressure(pressuremb), 74, 13, scale=1)

    i75.update(graphics)
    time.sleep (60)
