Here are two graphs showing historical data from the past week. (from Growspy) The first shows temperature, the second humidity.
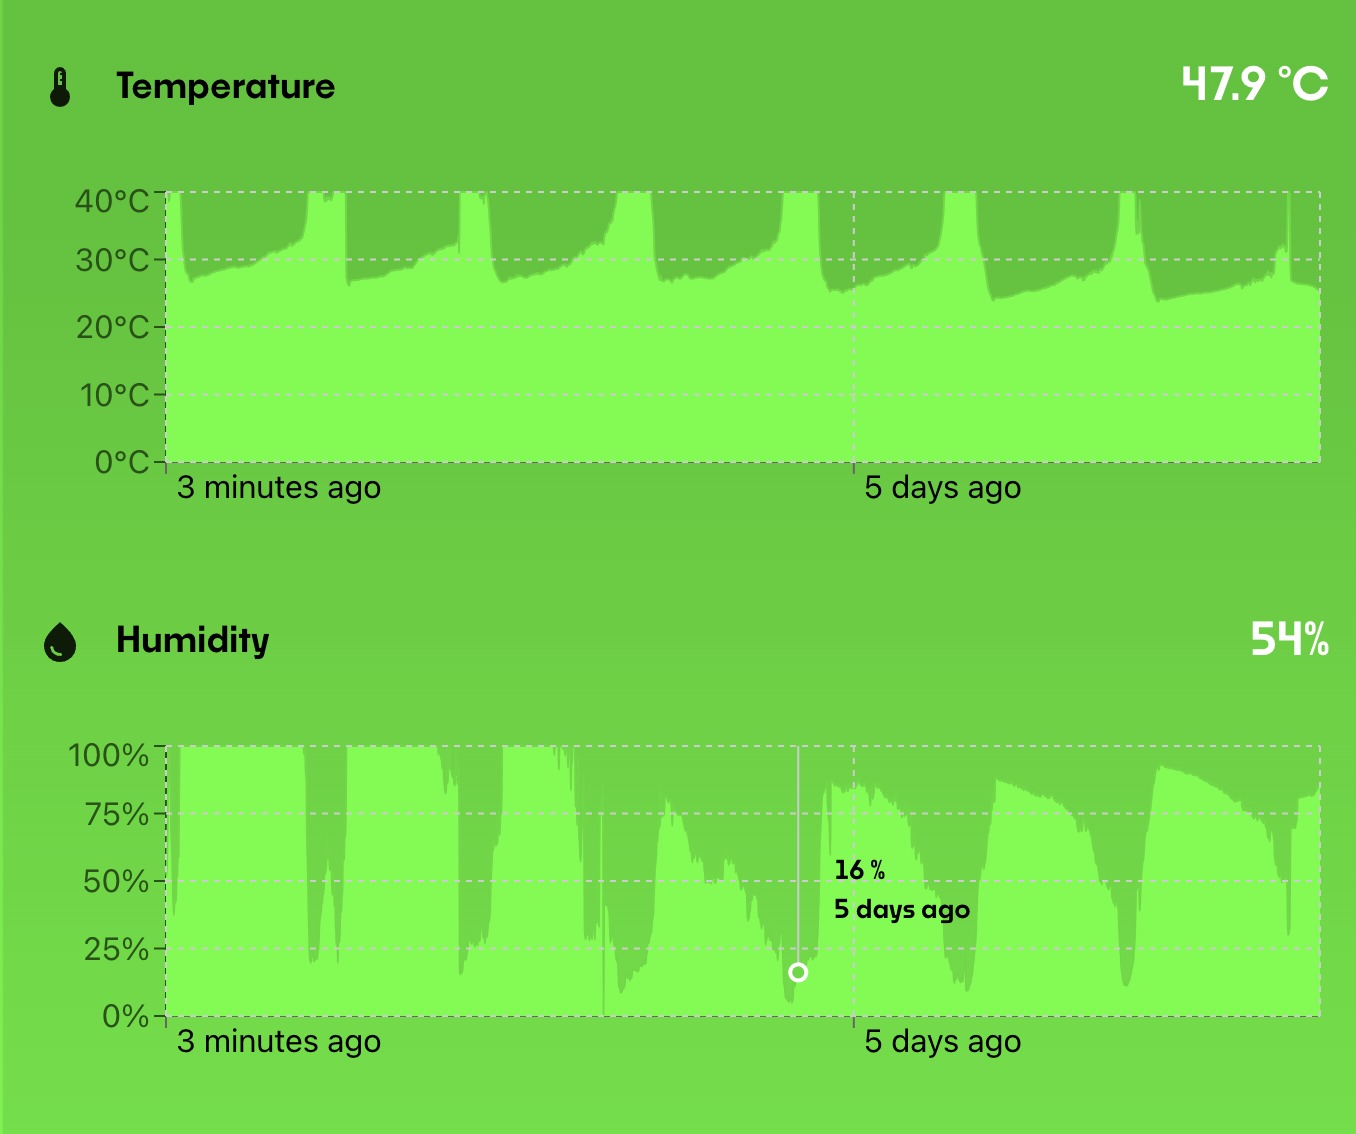
Both are measured by electronic sensors in the same place at the same time
The data unequivocally show that when the temperature goes up, the humidity goes down
Why? That isn’t what I was expecting. I have the idea that air can hold less water as it gets cooler. The data show exactly the opposite. There most be some other factor that I’m not taking into account which has a far bigger effect
What could that factor be? Any suggestions? Can you suggest an explanation for the empirical data?